
Maintenance, repairs, replacements
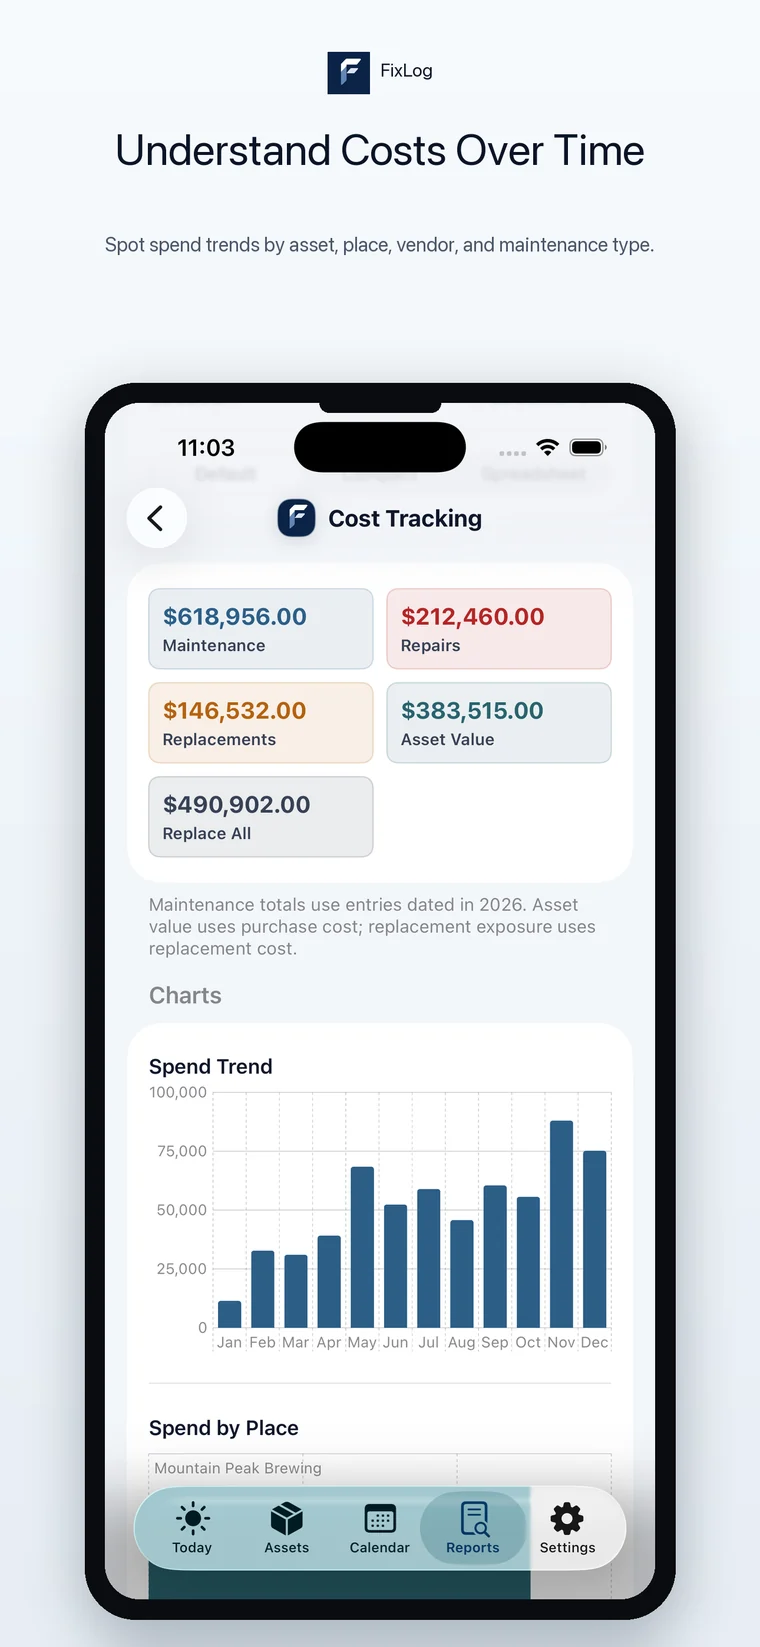
Totals split by type, so routine upkeep does not hide the reactive spend.
Repair cost tracking
Every maintenance entry in FixLog takes a cost, and every cost rolls up. See spend by month, by place, by service provider, and by type of work, next to what the asset cost to buy and what it would cost to replace.
The question nobody can answer
No single repair looks unreasonable. Four repairs on the same unit over eighteen months usually do, but only if someone added them up. Logging the cost with the work is what makes that addition possible.
Totals split by type, so routine upkeep does not hide the reactive spend.
A month-by-month chart of what maintenance is costing you across the Space.
Which location and which vendor the money is going to.
Purchase cost across your assets, so the records double as a rough equipment inventory value.
Replacement cost across the same list — what it would take to buy it all again today.
Send the numbers to a spreadsheet or a bookkeeper when it is time for a budget or a tax question.
Repair or replace
When a unit fails again, the useful comparison is the money already spent on it against the cost of replacing it. FixLog puts both on the same screen: the running repair spend from the maintenance entries, and the replacement cost from the asset record.
Cost is a field on the entry, not a separate bookkeeping step.
Repeat repairs on one asset are the signal worth acting on.
The Warranty Countdown catches spend that should not have been yours.
Maintenance, repair, and replacement totals with a monthly spend trend.
Cost reporting works because the entries exist. Start with the record, and the numbers follow.
Start counting
FixLog is free to download with example data. Cost tracking, charts, reports, and CSV export are part of Pro at $0.99 a month or $7.99 once.